
What is a good cost per lead, and how to work out yours
The right cost per lead is the most your numbers allow: customer value times close rate times target margin share, not the $66.69 industry median.
 By GroundBreaker Media5 min read

The median Google Ads cost per lead across industries was $66.69 in WordStream by LocaliQ’s 2026 benchmarks, and it says little about your business. A good cost per lead is one at or below the maximum your own numbers allow, set by customer value and close rate. Judge campaigns on cost per qualified lead and cost per customer.
Why do industry cost per lead averages mislead?
They blend businesses with different lead definitions, deal sizes and close rates. A cost per lead that loses money for one company can be very profitable for another.
The WordStream by LocaliQ 2026 benchmarks measure conversions as the actions each advertiser chose to track, so a lead in one account is not the same thing as a lead in another. The figures are medians from 13,474 US search advertising campaigns, and they move from year to year: median cost per lead fell 39.35% for travel and 29.54% for physicians and surgeons, and rose 13.90% for automotive sales. The report itself notes that "in many industries, advertisers can run campaigns with a high cost per lead and still turn a profit."
How do you calculate the maximum cost per lead you can afford?
Multiply the value of a customer by your lead-to-customer close rate, then by the share of that value you are willing to spend on acquisition.
Maximum cost per lead = customer value × close rate × target margin share
- Customer value: gross profit from a new customer over the period you can count on, not revenue.
- Close rate: the share of leads that become customers, taken from your CRM.
- Target margin share: the part of that profit you will spend to acquire the customer.
Any cost per lead at or below the result is affordable at your current close rate. Raise the close rate and the ceiling rises without touching the ads. The same inputs drive a full Google Ads budget.
What are average cost per lead benchmarks by industry?
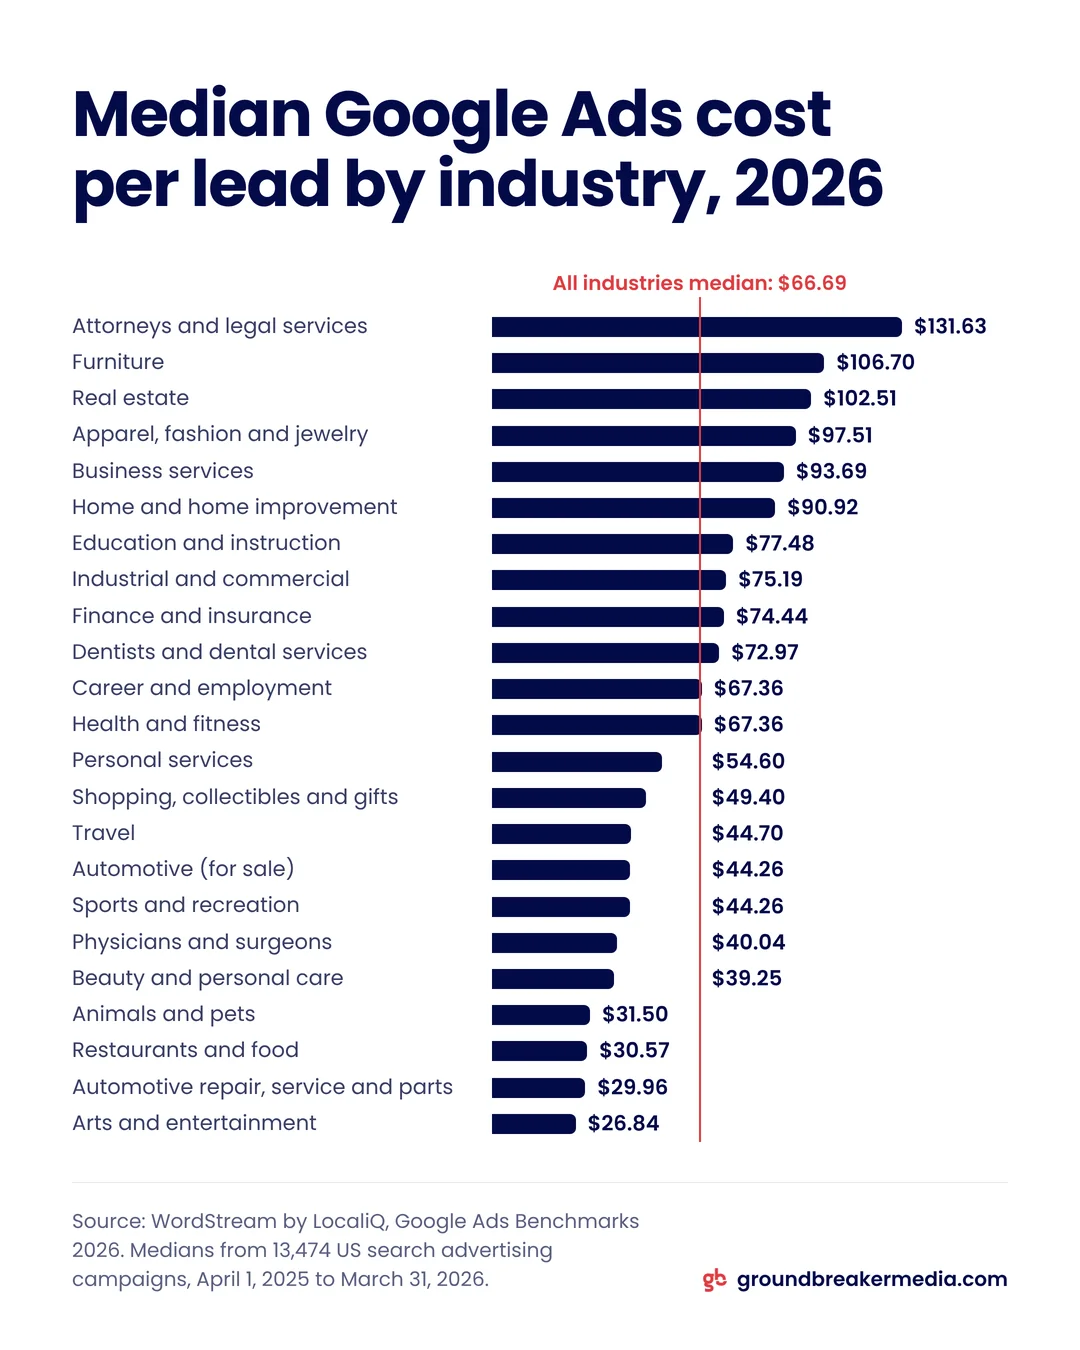
The 2026 WordStream by LocaliQ report puts the median Google Ads cost per lead across industries at $66.69, down from $70.11 in the 2025 report. Industry medians range from $26.84 in arts and entertainment to $131.63 for attorneys and legal services.
| Industry | Median cost per lead (2026 report) |
|---|---|
| Attorneys and legal services | $131.63 |
| Furniture | $106.70 |
| Real estate | $102.51 |
| Business services | $93.69 |
| Home and home improvement | $90.92 |
| Education and instruction | $77.48 |
| Finance and insurance | $74.44 |
| Dentists and dental services | $72.97 |
| Health and fitness | $67.36 |
| Physicians and surgeons | $40.04 |
| Beauty and personal care | $39.25 |
| Restaurants and food | $30.57 |
| Automotive repair, service and parts | $29.96 |
| Arts and entertainment | $26.84 |
Source: WordStream by LocaliQ, Google Ads benchmarks 2026, based on campaigns running April 1, 2025 to March 31, 2026. The 2025 comparison is from PPC Land. Use these numbers to sanity-check a forecast, not to set a target.
How do you work out your own cost per lead target?
Pull customer value and close rates from your CRM, apply the formula, then convert the result into a cost per qualified lead so campaigns are judged on quality.
Cost per qualified lead = ad spend ÷ leads that meet your sales criteria
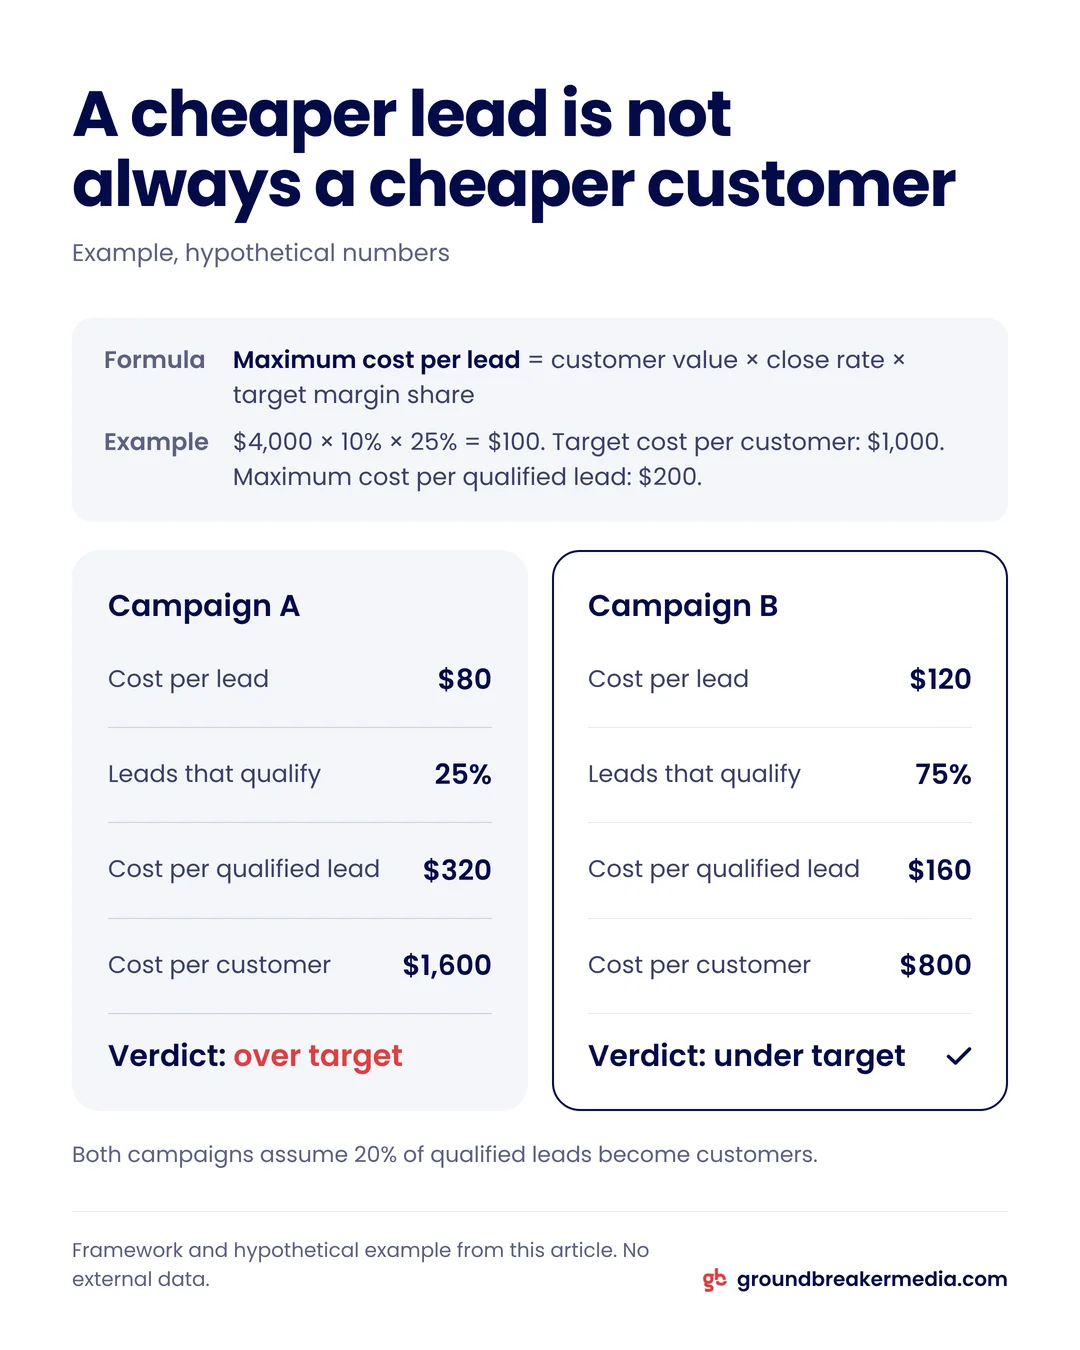
Example (hypothetical numbers): a business earns $4,000 in gross profit from a typical new customer, closes 10% of all leads and is willing to spend 25% of gross profit on acquisition.
- Maximum cost per lead: $4,000 × 10% × 25% = $100
- Target cost per customer: $4,000 × 25% = $1,000
- Half of all leads qualify and only qualified leads close, so 20% of qualified leads close, and the maximum cost per qualified lead is $1,000 × 20% = $200
Now compare two campaigns, assuming 20% of qualified leads close in both. Campaign A produces leads at $80, but only 25% qualify: $320 per qualified lead and $1,600 per customer. Campaign B produces leads at $120, and 75% qualify: $160 per qualified lead and $800 per customer. Campaign A looks cheaper and loses money. Campaign B looks expensive and is the one to fund.
GroundBreaker Media reports client results as cost per customer for this reason, using the CRM-to-ad-platform measurement it sets up through its solutions. Where cost per lead, qualified rate and cost per customer sit in a monthly review is covered in the five-minute report guide.
Which cost should Google Ads optimize toward?
Optimize toward the deepest funnel stage that still produces enough volume, usually a qualified lead imported from your CRM.
Google’s value-based bidding advice tells you to "select a single stage of your lead-to-sale funnel as your bid optimization goal," and the Google Ads budget guide sets out how much monthly volume that stage needs. Its conversion values guidance recommends measuring at least two unique, non-zero values. Enhanced conversions for leads, which Google now recommends over the older offline conversion import, sends those CRM stages back to Google Ads, and the article on platform and CRM revenue gaps shows the setup. Once bidding sees qualified leads instead of raw form fills, it can work toward the cost that matters, and the same applies to automated Performance Max campaigns.
Frequently asked questions
Is a high cost per lead always bad?
No. A high cost per lead is fine when close rates and customer value support it. WordStream’s 2026 benchmark report notes that in many industries advertisers can run campaigns with a high cost per lead and still turn a profit. Judge each campaign on cost per qualified lead and cost per customer, which show whether the spend pays back.
Does a higher close rate raise my maximum cost per lead?
Yes, in direct proportion. Because the maximum cost per lead equals customer value × close rate × target margin share, a business that closes more of its leads can afford to pay more for each one without changing the ads. Recalculate the ceiling whenever your CRM shows the close rate moving.
Should customer value be based on revenue or gross profit?
Use gross profit. Revenue still carries the costs of delivering the product or service, so a ceiling built on revenue lets you pay more per lead than a customer can return. Count the gross profit from a new customer over the period you can rely on, and keep that definition the same each time you recalculate.
How much do cost per lead benchmarks change from year to year?
Enough to matter. Between WordStream by LocaliQ’s 2025 and 2026 reports, the all-industry median fell from $70.11 to $66.69, while travel fell 39.35%, physicians and surgeons fell 29.54% and automotive sales rose 13.90%. Recheck benchmarks with each new report, and use them as a sanity check rather than a target.
Written by
GroundBreaker Media
A performance marketing agency that connects what you spend to what it brings back. About us
Related insights
All insights


Want one version of the truth? Let's look at your numbers.
A short call, an honest read on what your marketing is producing, and clear next steps.