
How to read a marketing report in five minutes
Eight numbers, read in order from spend to return, show whether your marketing paid; clicks, impressions and engagement can wait for the ad team.
 By GroundBreaker Media5 min read

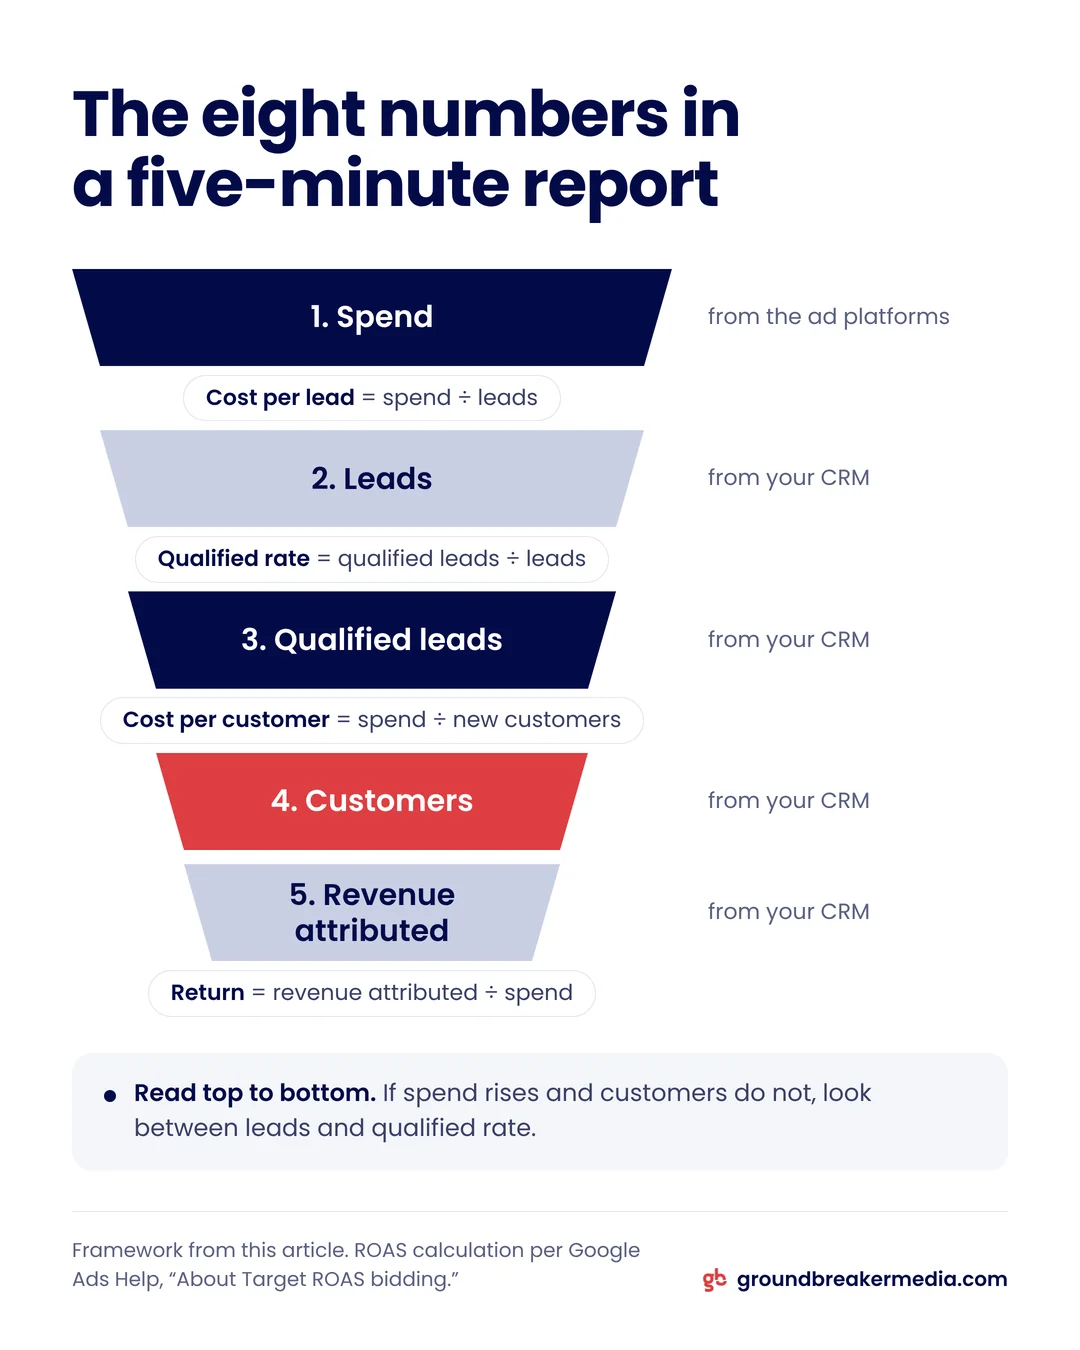
Eight numbers, read in order, tell you whether your marketing paid: spend, leads, cost per lead, qualified rate, customers, cost per customer, revenue attributed and return. Together they show whether the money came back and where the funnel leaks. Impressions, clicks and engagement belong to the team running the ads, not to your five minutes.
Which numbers should I check first?
Start with spend and end with return. Everything in between explains how one became the other.
Paid media deserves a fixed review. In Gartner’s 2025 CMO Spend Survey of 402 marketing leaders, paid media accounted for 30.6% of marketing budgets, the largest category of spend.
| Metric | Formula or source | The question it answers |
|---|---|---|
| Spend | Total billed by the ad platforms for the period | How much went out? |
| Leads | Unique inquiries from paid campaigns, counted in the CRM | How many people raised a hand? |
| Cost per lead | Spend ÷ leads | What does one inquiry cost? |
| Qualified rate | Qualified leads ÷ leads | Are the ads reaching buyers? |
| Customers | New customers from those leads | Did anyone buy? |
| Cost per customer | Spend ÷ new customers | What does one customer cost? |
| Revenue attributed | Revenue from those new customers, from the CRM | What came back? |
| Return | Revenue attributed ÷ spend | Did it pay? |
Read the table from top to bottom. If spend rose and customers did not, the problem sits somewhere between leads and qualified rate.
Client reports under GroundBreaker Media’s Revenue Infrastructure work this way, and its results page shows what they look like.
Why is cost per lead not enough on its own?
Cost per lead only means something next to qualified rate and cost per customer. A cheap lead that never buys is the most expensive lead in the report.
Cost per lead = ad spend ÷ leads
Qualified rate = qualified leads ÷ total leads
Cost per customer = ad spend ÷ new customers
A campaign can cut its cost per lead by reaching people who will never buy, and its cost per customer will rise as a result. Compare campaigns on cost per customer first, then use cost per lead to judge efficiency between campaigns with similar qualified rates.
"Qualified" needs a written definition that the agency and the sales team share, or the qualified rate means nothing. The highest cost per lead your margins can carry is a separate calculation, set out in the guide to a good cost per lead.
What is the difference between ROAS and ROI?
ROAS divides revenue by ad spend. ROI subtracts all costs before dividing, so it tells you whether the business made money.
Google’s target ROAS help page shows the calculation as "$5 USD in sales ÷ $1 USD in ad spend x 100% = 500% target ROAS." That is a revenue ratio, not profit.
Return on ad spend (ROAS) = revenue attributed ÷ ad spend
Return on investment (ROI) = (gross profit from attributed revenue minus total marketing cost) ÷ total marketing cost
Total marketing cost includes agency fees, creative and tools, not only media. A high ROAS on a low-margin product can still lose money. The revenue in either formula should come from your CRM or sales system rather than from the ad platform’s conversion value.
What can I safely skip?
You can skip impressions, reach, clicks, click-through rate and engagement. They help the people running the account diagnose problems, but none of them tells you whether the money came back.
Treat any total labeled "conversions" with care until you know which column it comes from. Google’s All conversions column adds actions that the main Conversions column leaves out, while view-through conversions sit outside the Conversions column altogether. A report built on "All conversions" can look much better than the leads in your CRM.
Look at the diagnostic metrics only when one of the eight numbers moves without an obvious reason.
Why do last month’s numbers keep changing?
Google Ads assigns conversions to the date of the ad click, and reporting can lag up to 24 to 48 hours, so a closed month keeps filling in after it ends. Long sales cycles stretch the effect, which the ad platform versus CRM explainer walks through.
Ask for reports to be pulled on a fixed day each month, with a note when figures for a past period were updated. If you need numbers that line up with your sales ledger by month, Google’s article on conversions by time describes "by conv. time" columns that date conversions to when they happened.
What are the red flags in an agency report?
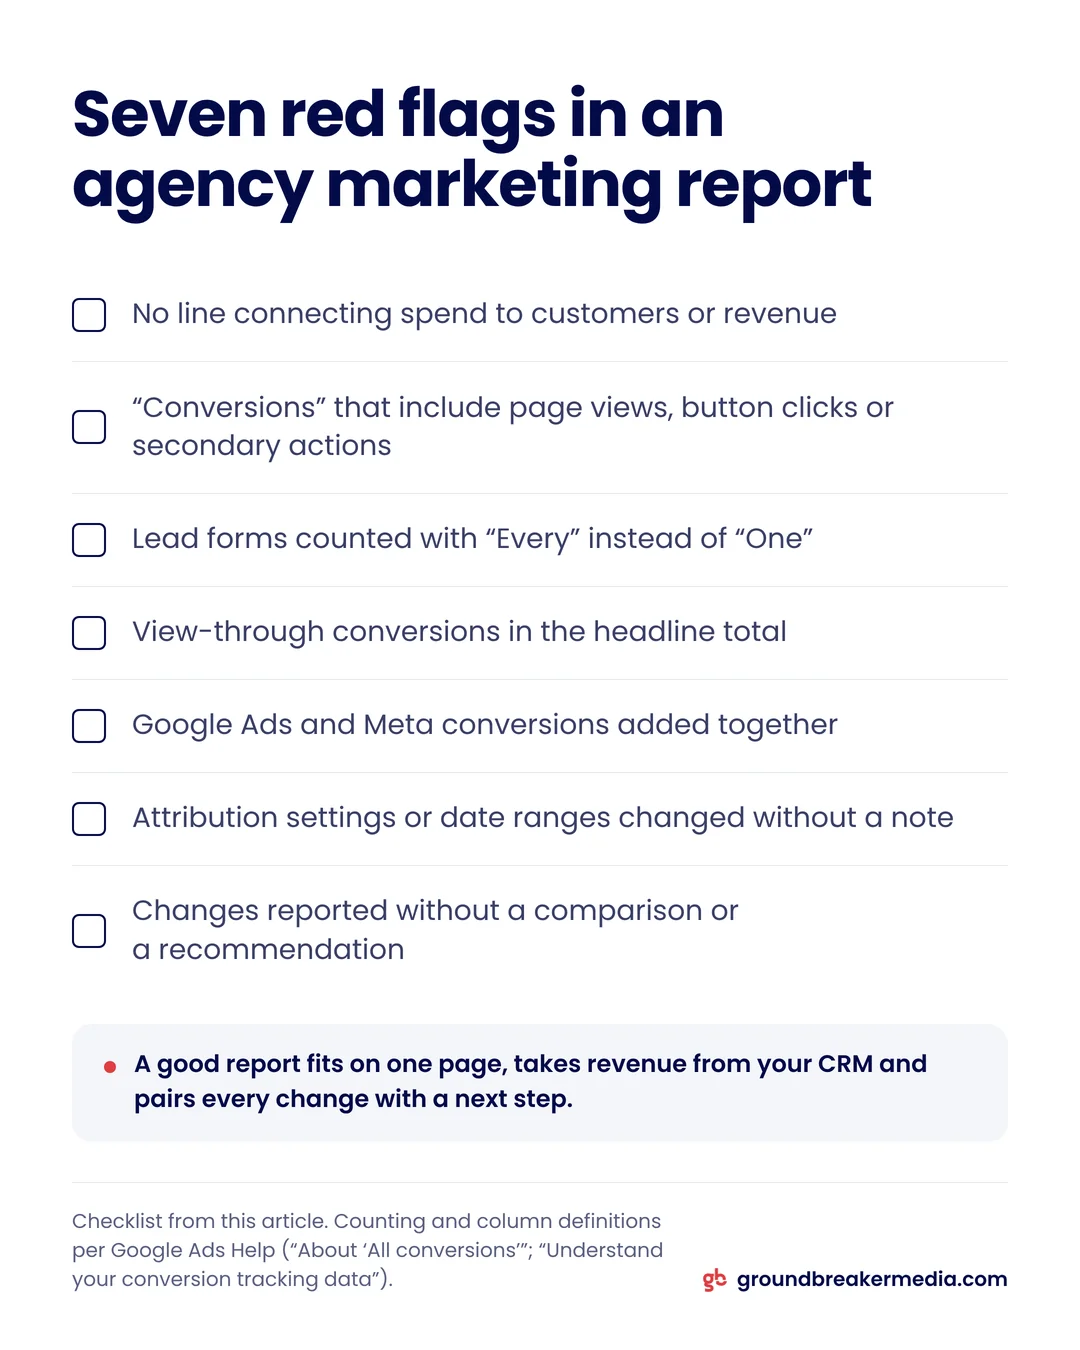
The biggest red flags are results that never reach your CRM, conversion counts padded with soft actions and definitions that change between reports.
Watch for:
- No line connecting spend to customers or revenue.
- "Conversions" that include page views, button clicks or other secondary actions.
- Lead forms counted with "Every" instead of "One." Google advises "One" for lead actions, so a refreshed page does not become a second lead.
- View-through conversions added into the headline total.
- Google Ads and Meta conversions added together as if they were separate sales.
- Attribution settings or date ranges that change without a note. Meta’s Insights API defaults to 7-day click and 1-day view, so a report should say which window it uses.
- No comparison to the previous period, and changes reported without a recommendation.
A good report fits on one page, takes its revenue from your CRM and pairs every change with a next step.
Frequently asked questions
How often should a business owner review a marketing report?
A monthly review of the eight core numbers is enough for most businesses, with a quick weekly look at spend and leads to catch problems early. Monthly reviews give longer sales cycles time to show results. Because Google Ads assigns conversions to the click date, compare months only after the figures have settled for a few days.
What is a good return on ad spend?
It depends on your margins. A useful floor is break-even ROAS, the point where gross profit covers ad spend: break-even ROAS = 1 ÷ gross margin, with margin as a decimal. A business with a 50% gross margin needs revenue of at least twice its ad spend before agency fees and other costs. Anything above that floor contributes profit.
What counts as a qualified lead?
A qualified lead meets written criteria your sales team agrees on, such as being inside your service area, needing what you sell and having a realistic budget and timeline. The definition matters more than the wording. It should be recorded in the CRM, applied the same way every month and shared with whoever runs your ads.
What should a marketing report say besides the numbers?
It should compare each figure with the previous period, explain what changed and attach a recommended next step to every change. It should also state which attribution setting it uses and flag any past figures updated since the last report. Revenue should come from your CRM, while spend comes from the ad platforms that bill it.
Written by
GroundBreaker Media
A performance marketing agency that connects what you spend to what it brings back. About us
Related insights
All insights


Want one version of the truth? Let's look at your numbers.
A short call, an honest read on what your marketing is producing, and clear next steps.