
What a marketing dashboard should show, and how attribution splits the credit
A marketing dashboard should join ad spend, GA4 and CRM sales on one screen and name its attribution model, since Google retired four models in 2023.
 By GroundBreaker Media7 min read

Since November 2023, Google Analytics has offered just three attribution models, and a marketing dashboard should state which one it uses. Around that label, the dashboard needs spend from each ad platform, site behavior from Google Analytics 4 (GA4), and leads, customers and revenue from the CRM, each marked with when it last refreshed.
What should a marketing dashboard show?
A marketing dashboard should show, on one screen, what was spent, what it produced in the CRM, and how each channel earned its credit.
Gartner’s research links this kind of work to credibility. In a 2024 Gartner survey of 378 senior marketing leaders, only 52% said they were successful in proving the value of marketing. Respondents involved in more activities in their role, such as creating marketing dashboards, were 1.4 times more likely to prove value and get credit.
A marketing reporting dashboard differs from a monthly report in one way: it updates on its own, so it has to explain itself without anyone presenting it. Its headline numbers are the eight from the guide to reading a marketing report, from spend through return. What follows is the frame around them.
| Panel | What it holds | Where the data comes from |
|---|---|---|
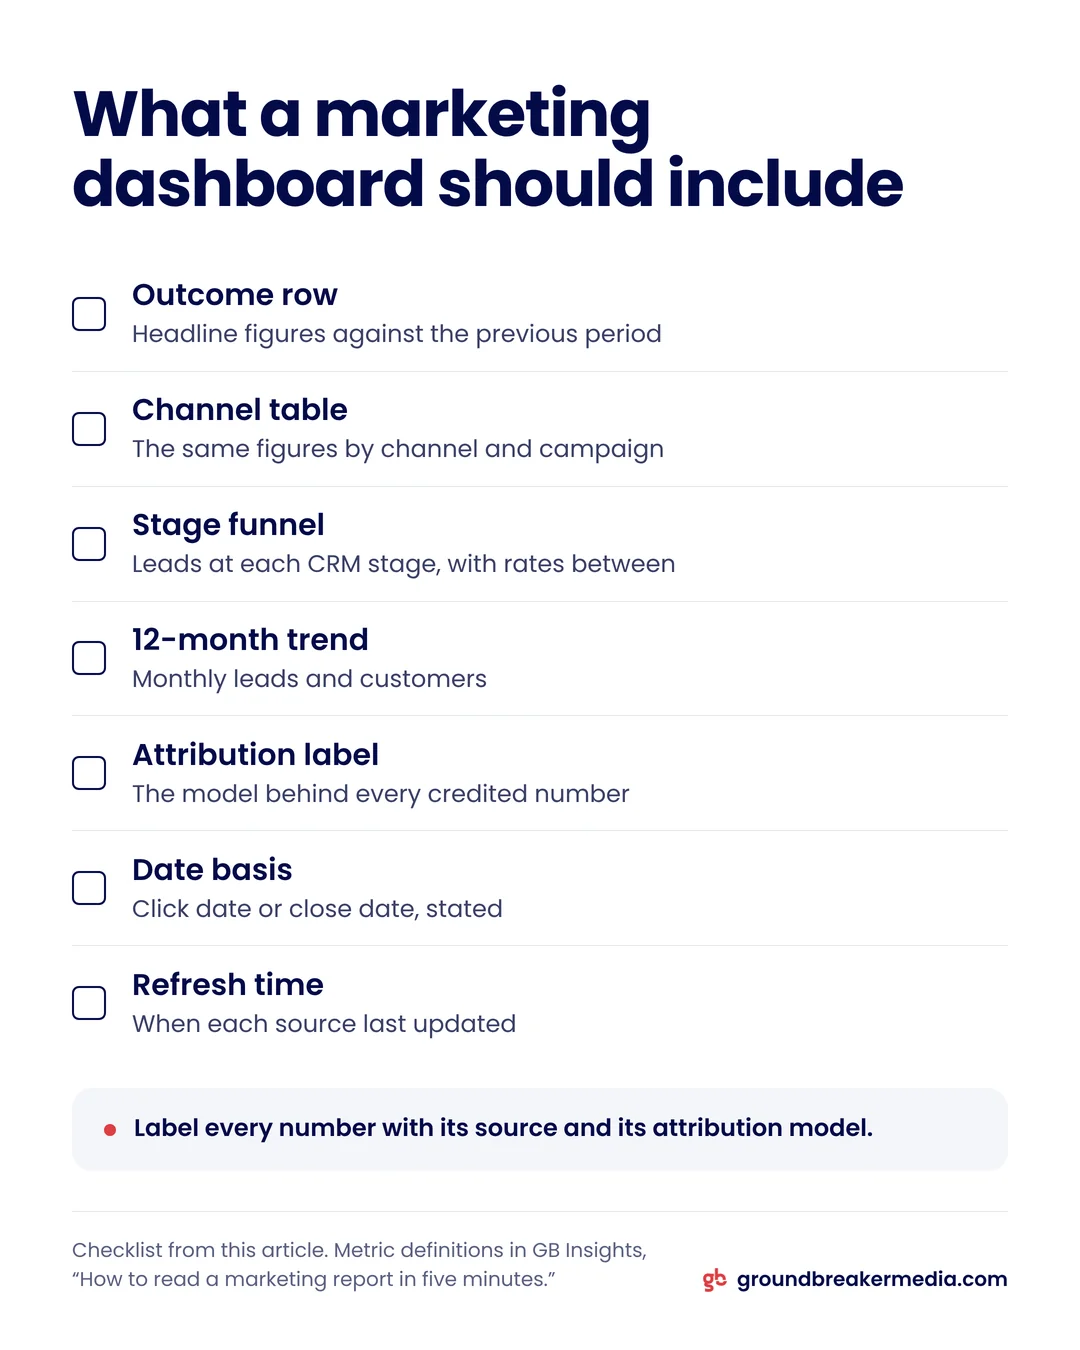
| Outcome row | The period’s headline figures against the previous period | Ad platforms for spend, CRM for everything after the lead |
| Channel table | The same figures by channel and campaign | Ad platforms and CRM source fields |
| Stage funnel | Leads at each CRM stage and the rate between stages | CRM |
| 12-month trend | Monthly leads and customers, to show seasonality | CRM |
| Data notes | Attribution model, date basis and last refresh time | Whoever maintains the dashboard |
The data notes panel is the easiest to leave out and the one that settles disagreements. A channel’s share of credit changes when the model changes, and a month dated by ad click looks different from one dated by close. Printing both choices on the screen keeps every reader on the same version.
Which data sources feed a marketing dashboard?
Three sources cover most small businesses: the ad platforms for spend and the results each claims, GA4 for behavior on your site, and the CRM for leads, stages and revenue.
- Ad platforms such as Google Ads, Meta, Microsoft Advertising and LinkedIn supply spend, impressions, clicks and the conversions each one credits to itself.
- GA4 supplies sessions, key events and traffic source across every channel, including organic search and direct visits.
- Your CRM supplies leads, stages, customers and revenue, using the source fields set out in the CRM guide.
- Call tracking and Google Search Console join when phone calls or organic search carry real volume.
Google renamed Looker Studio to Data Studio on April 16, 2026, according to its release notes. Data Studio’s connector list covers Google Ads, Google Analytics, Search Console, Google Sheets and BigQuery, while Meta Ads data arrives through partner connectors built by other companies, several of them added in 2026. GA4 can also import Meta cost, clicks and impressions through a Meta connection, provided every Meta ad URL carries consistent utm_source and utm_medium values. CRM data usually comes in through a spreadsheet, BigQuery or a third-party connector.
Each source runs on its own clock. Data Studio refreshes Google Ads data every 12 hours and Google Sheets every 15 minutes by default, while Google says GA4 processing can take 24 to 48 hours, with some data arriving up to 7 days late. Show the last refresh time on every panel.
GroundBreaker Media builds client dashboards on this three-source pattern as part of Revenue Infrastructure.
What is marketing attribution?
Marketing attribution is the method that decides which ads and channels get credit for a lead or sale when the buyer touched more than one.
Attribution model: "a rule, a set of rules, or a data-driven algorithm that determines how credit is assigned to touchpoints," in Google Analytics’ definition.
Credit gets assigned in three places, and each sees a different slice of the path:
- Each ad platform credits only its own ads, inside lookback windows that the attribution window comparison lays out.
- GA4 credits the channels that brought visits to your site, and under every model gives direct visits no credit unless the whole path was direct (Google Analytics Help).
- The CRM records the first and latest known channel on each lead. HubSpot’s attribution reports add models on top: contact attribution on Marketing Hub or Content Hub Professional and Enterprise, and deal and revenue attribution on Marketing Hub Enterprise only.
Which attribution models do Google Ads and GA4 still offer?
Google Ads offers data-driven and last click, plus an external attribution option. GA4 offers three: data-driven, paid and organic last click, and Google paid channels last click.
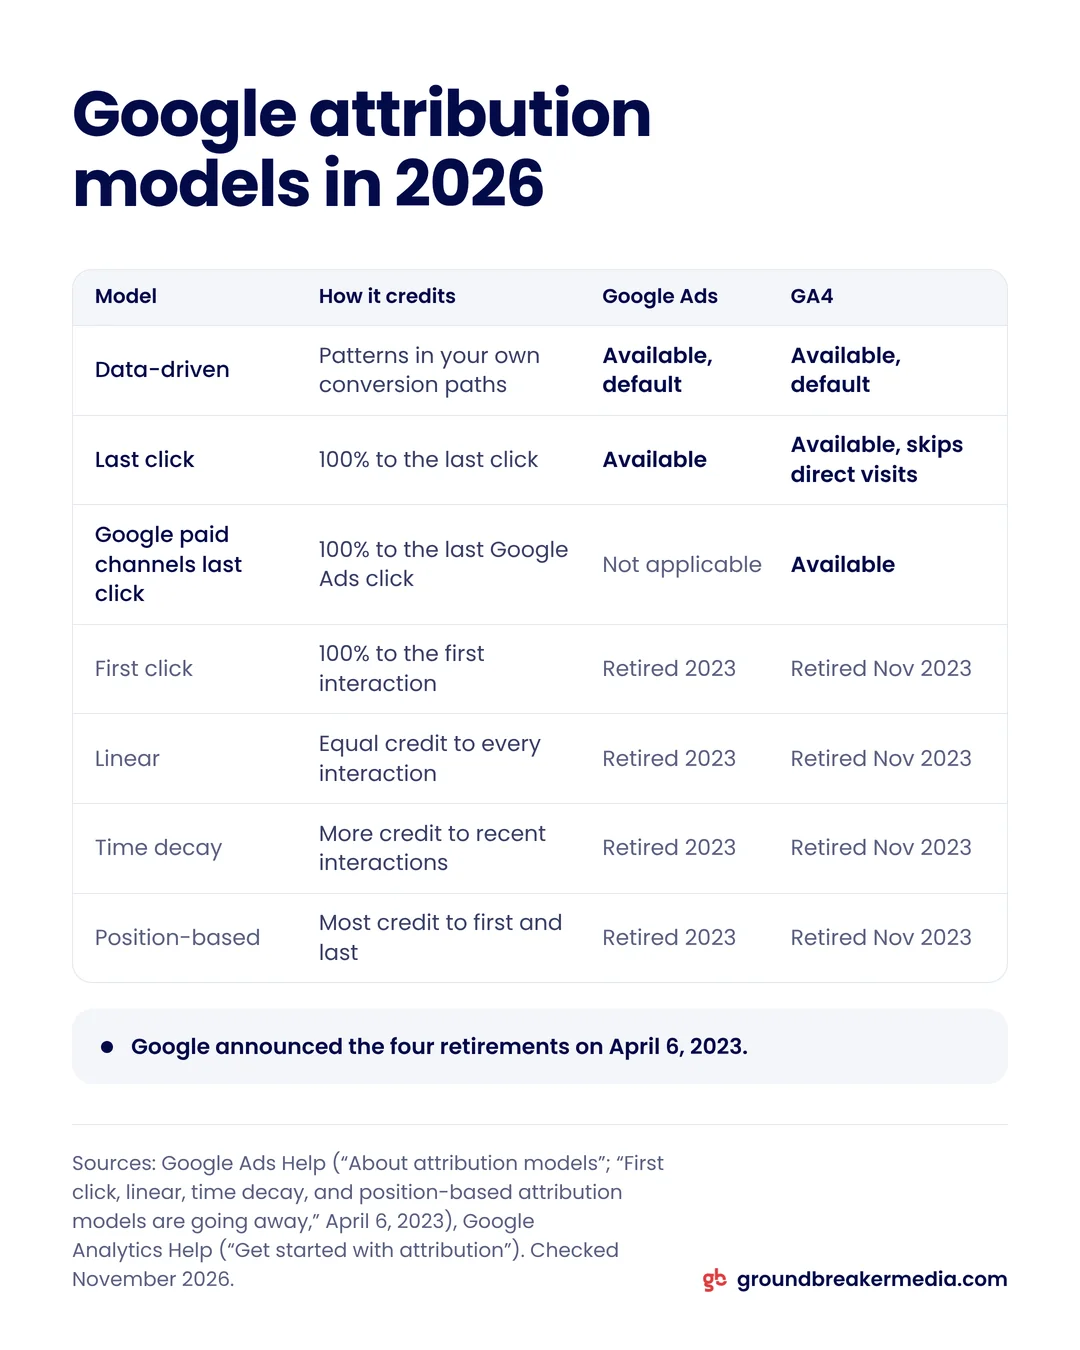
| Model | How it assigns credit | Google Ads | GA4 |
|---|---|---|---|
| Data-driven | By patterns in the account’s own conversion paths | Available, default for most conversion actions | Available, the default |
| Last click (GA4: paid and organic last click) | 100% to the last click; GA4 skips direct visits | Available | Available |
| Google paid channels last click | 100% to the last Google Ads click | Not applicable | Available |
| First click | 100% to the first interaction | Retired, 2023 | Retired, November 2023 |
| Linear | Equal credit to every interaction | Retired, 2023 | Retired, November 2023 |
| Time decay | More credit to recent interactions | Retired, 2023 | Retired, November 2023 |
| Position-based | Most credit to the first and last interactions | Retired, 2023 | Retired, November 2023 |
Google announced on April 6, 2023 that first click, linear, time decay and position-based would leave Google Ads and GA4. Google Ads removed them as a choice starting in June 2023 and began switching remaining conversion actions to data-driven in September 2023. Its attribution models page now says they "are no longer supported." GA4 calls paid and organic last click "last non-direct click," and its Google paid channels model falls back to it when no Google Ads click exists. In GA4, key event reports default to data-driven.
The rules-based models live on in CRM reporting. HubSpot lists nine models, including first interaction, last interaction, linear, time decay with a 7-day half-life, and U-shaped, which gives 40% each to the first interaction and the lead conversion.
How does data-driven attribution decide credit?
It compares the paths of people who converted with the paths of people who did not, then credits the ad interactions that the pattern links to conversions.
Google’s data-driven attribution page says each model "is specific to each advertiser" and, in Google Ads, covers clicks and video engagements on Search (including Shopping), YouTube, Display and Demand Gen. That makes it the right model for bidding inside Google Ads. It is a weak basis for a dashboard total. In Google Ads it sees only Google ad interactions. In GA4 it sees channels that reached your site, but not a word-of-mouth referral, a trade show or the sales call that closed the deal.
The useful reading is the gap between models. GA4’s model comparison report, listed under Advertising as Attribution models, shows a channel under two models side by side.
Model gap = conversions credited to a channel under data-driven ÷ conversions credited to it under last click
Example (hypothetical numbers): a channel credited with 30 conversions under data-driven and 20 under last click has a model gap of 1.5. It assists more sales than it finishes, so judging it on last click alone undercounts it. A gap below 1 marks a channel that mostly closes sales other channels started.
Which attribution model should a small business use?
Use data-driven inside Google Ads for bidding, use the CRM’s recorded source for channel credit on the dashboard, and take totals from CRM customers rather than from any model.
The CRM already holds two views. Original source, the first known channel, is a first-touch view, and latest source is a last-touch view. Put them in adjacent columns of the channel table. A channel strong on first touch and weak on last touch is introducing buyers that other channels close. When the two disagree on a large deal, the self-reported "How did you hear about us?" answer breaks the tie.
Totals come from the CRM, never from adding up what each model or platform credits. Pick one model per view and keep it, because changing models mid-year breaks month-to-month comparisons. If you do change, mark the date on the dashboard.
How do you check attribution against what really happened?
Run an experiment. Attribution divides credit for sales that happened, while a test with a holdout group shows what the ads caused.
Google lowered the cost of entry in a November 11, 2025 announcement: "What once might have cost upwards of $100,000 for a single experiment can now be done for $5,000." For a view across all channels, Google opened Meridian, its open-source marketing mix model, to everyone on January 29, 2025. A marketing mix model estimates each channel’s effect from aggregated spend and results over time. Google calls that approach privacy-centric, because it works from grouped data rather than individual user records.
A smaller business can run a plainer test. Pause one campaign for a set period, mark the dates on the dashboard, and watch CRM leads from that campaign’s audience or area. If leads hold steady, much of the credit that campaign was claiming would likely have arrived anyway.
Frequently asked questions
Do I need separate software for a marketing dashboard?
Not at first. HubSpot’s free tools include 10 dashboards with 50 reports each, and its Starter plan raises that to 30, according to HubSpot’s pricing page accessed November 3, 2026. Separate software such as Google’s Data Studio, formerly Looker Studio, earns its place once ad platform spend, GA4 data and CRM stages need to sit on one page.
What replaced first-click attribution in Google Analytics?
No model replaced it. First click left GA4 in November 2023, but the User acquisition report still shows first user source and medium, a user-scoped value that records how each person was first acquired and stays fixed when they return. In the CRM, an original source field does the same job for each lead.
Does data-driven attribution work for small accounts?
It runs at any volume, with less precision at low volume. Google says all conversion actions are eligible for data-driven attribution regardless of conversion or interaction volume, and recommends at least 200 conversions and 2,000 ad interactions in supported networks within a 30-day period. Below that, treat its credit splits as rough estimates.
What is multi-touch attribution?
Multi-touch attribution splits credit for a conversion across several touchpoints instead of giving it all to one. Data-driven attribution does this from your account’s own data. Linear, time decay and position-based were rules-based versions that Google retired in 2023, while HubSpot still offers rules-based options such as U-shaped, W-shaped and full path.
Written by
GroundBreaker Media
A performance marketing agency that connects what you spend to what it brings back. About us
Related insights
All insights


Want one version of the truth? Let's look at your numbers.
A short call, an honest read on what your marketing is producing, and clear next steps.